
This tutorial walks you through installing Wireshark, launching it correctly, setting a capture filter before you start, and interpreting what you see.
In Part 1, we introduced Wireshark, a powerful tool that lets you see everything that’s happening when your computer connects to the internet. Every time you open a website, check your email, or stream a video, your system sends and receives tiny packets of data. Wireshark shows you those packets in real time.
Step 1: Install Wireshark
If you’re using GhostBSD, you can install Wireshark in two ways:
- Software Station
- Open Software Station
- Search for Wireshark
- Terminal
sudo pkg install wiresharkStep 2: Launch Wireshark
Launch Wireshark with elevated permissions:
sudo wiresharkThis ensures you can capture packets from your network interfaces.
Step 3: Stop for a Moment
When the GUI opens, do not start capturing yet.
Instead, take a moment to:
- Identify your active network interface (e.g.,
em0,re0,wlan0) - Enter a capture filter to focus on specific traffic
Step 4: Why Use a Capture Filter
Capture filters reduce noise by telling Wireshark what to record. You enter them in the Capture Filter field next to your chosen interface.
Here are a few filters to get you started:
| Filter | What It Captures | Use Case Example |
|---|---|---|
port 53 | DNS traffic | See which domains your system is resolving |
port 80 | Unencrypted HTTP | Watch basic web requests (if any) |
port 443 | Encrypted HTTPS | See secure site connections (metadata only) |
icmp | Ping and connectivity tests | Observe echo requests and replies |
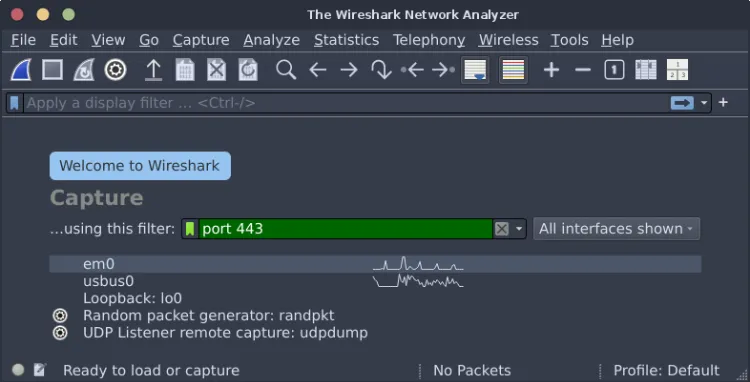
Once you’ve entered a filter, click the blue shark fin icon next to your interface to begin capturing.
Step 5: Interpret What You See
Depending on your filter, here’s what to expect:
If you used port 53 (DNS):
- You’ll see queries to resolve domain names (e.g.,
example.com) - Look for
Standard queryandStandard query responsein the Info column
If you used icmp:
- You’ll see
Echo (ping) requestandEcho reply - Useful for testing connectivity between computers on your network
If you used port 443:
- You’ll see encrypted traffic to websites
- You won’t see content, but you’ll see which servers are contacted
If you used port 80:
- You may see full HTTP requests and responses (if any unencrypted traffic exists)
- Look for GET/POST methods and response codes
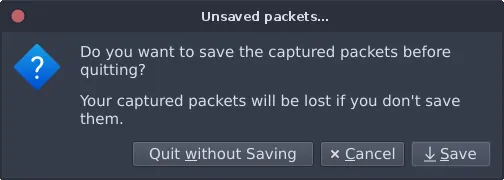
Step 6: Save Your Capture
When you’re done:
- Click the red square to stop
- A pop-up will prompt you to → Save your session
How to Delete Wireshark
Wireshark is as easy to remove as it is to install.
sudo pkg delete wiresharkUse It Responsibly
Wireshark is a powerful tool, and with that power comes responsibility. Unlike whois and traceroute, which are legal and safe to use on public domains and IPs, Wireshark captures live network traffic and must only be used on networks you own or have explicit permission to monitor.
Running Wireshark on your own home network is completely legal. In fact, it’s one of the best ways to understand what’s happening behind the scenes.
Here’s how Wireshark can help you:
- Is your internet acting up? Use a capture filter like
port 53to watch DNS requests and see if your system is struggling to resolve websites. - Curious what happens when you open a browser? Filter with
port 443to see encrypted HTTPS connections initiate. You’ll see the handshake, the server IP, and the timing. - Wondering if a program is “phoning home”? Capture traffic from your interface and look for unexpected connections to external servers. You’ll see the destination IP, protocol, and frequency.
These are real, practical ways to use Wireshark, not just theory.
But here’s the boundary you must respect: never capture traffic on networks you don’t own or control. That includes public Wi-Fi, school or work networks, or your neighbor’s router. Doing so without permission violates many laws and will get you into serious legal trouble.
⚠️ The “shark” in Wireshark isn’t just branding. Use it where you have full control, or risk getting bitten.